Numbers and Probability
As I work as a statistician, I start to see statistics in many things. Yet, when I was asked to describe what statisticians do, I surprisingly have little explanation available to answer what I really do and how statistical theories work empirically.
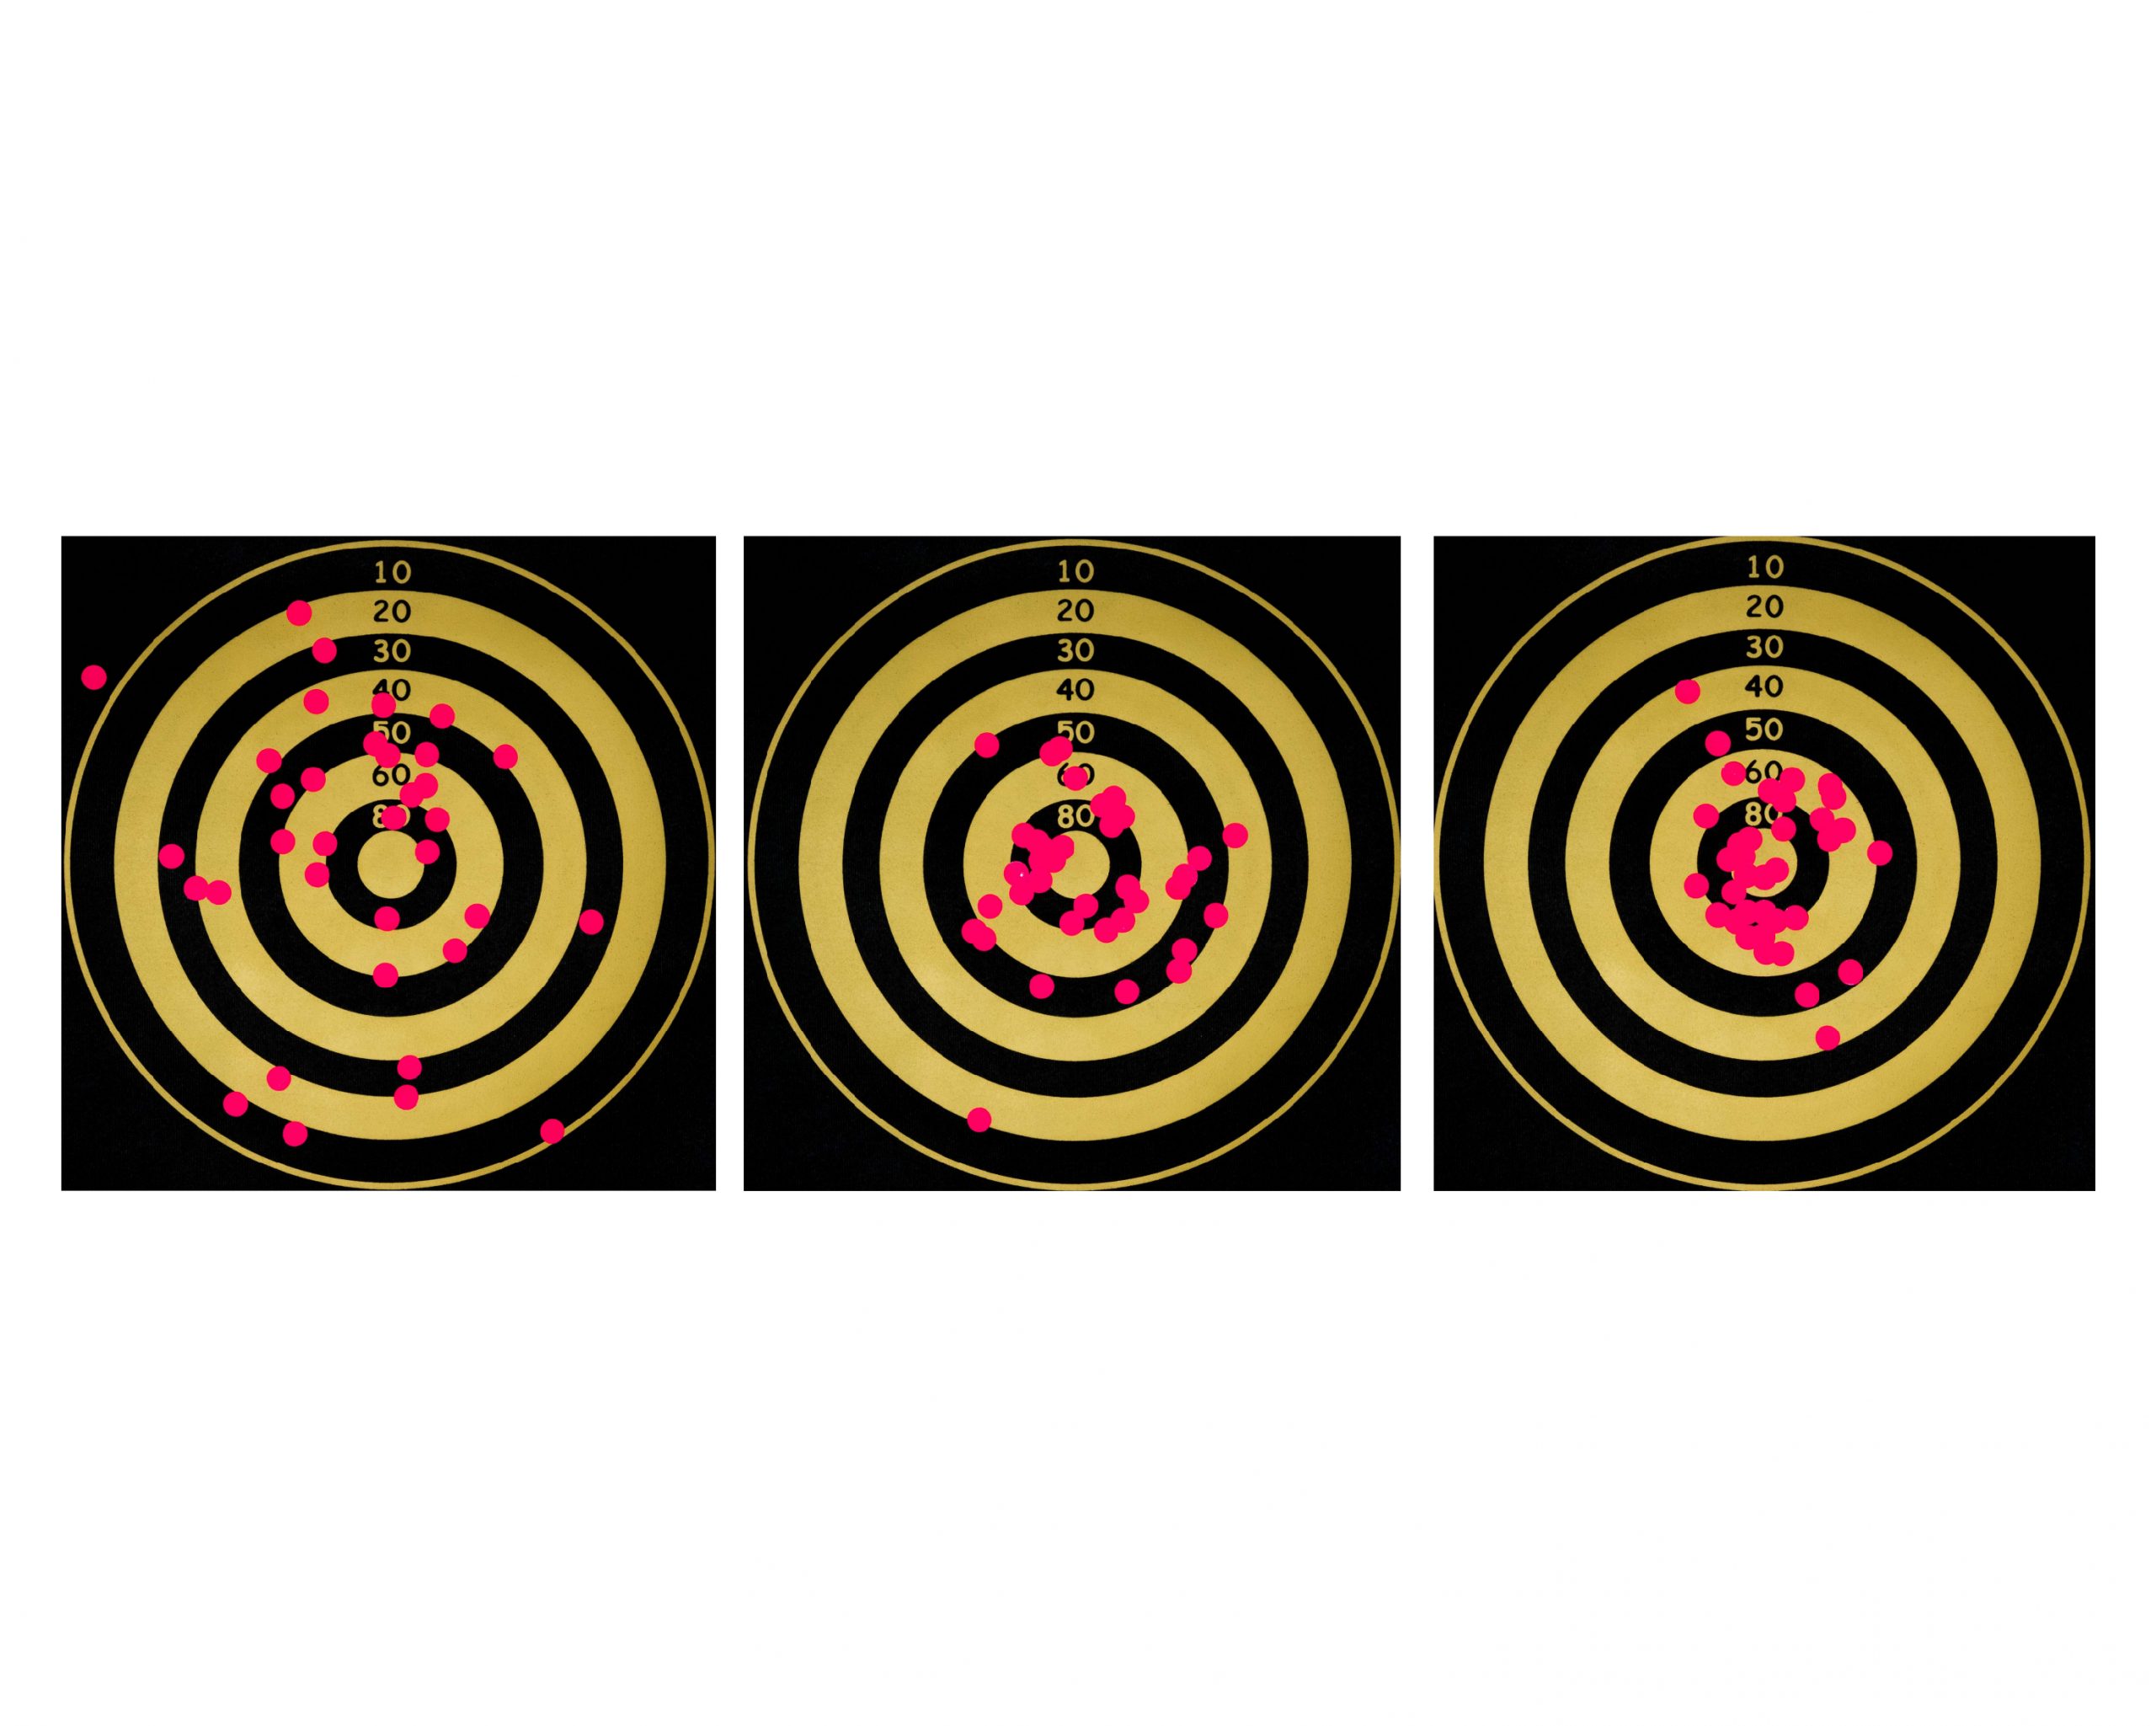
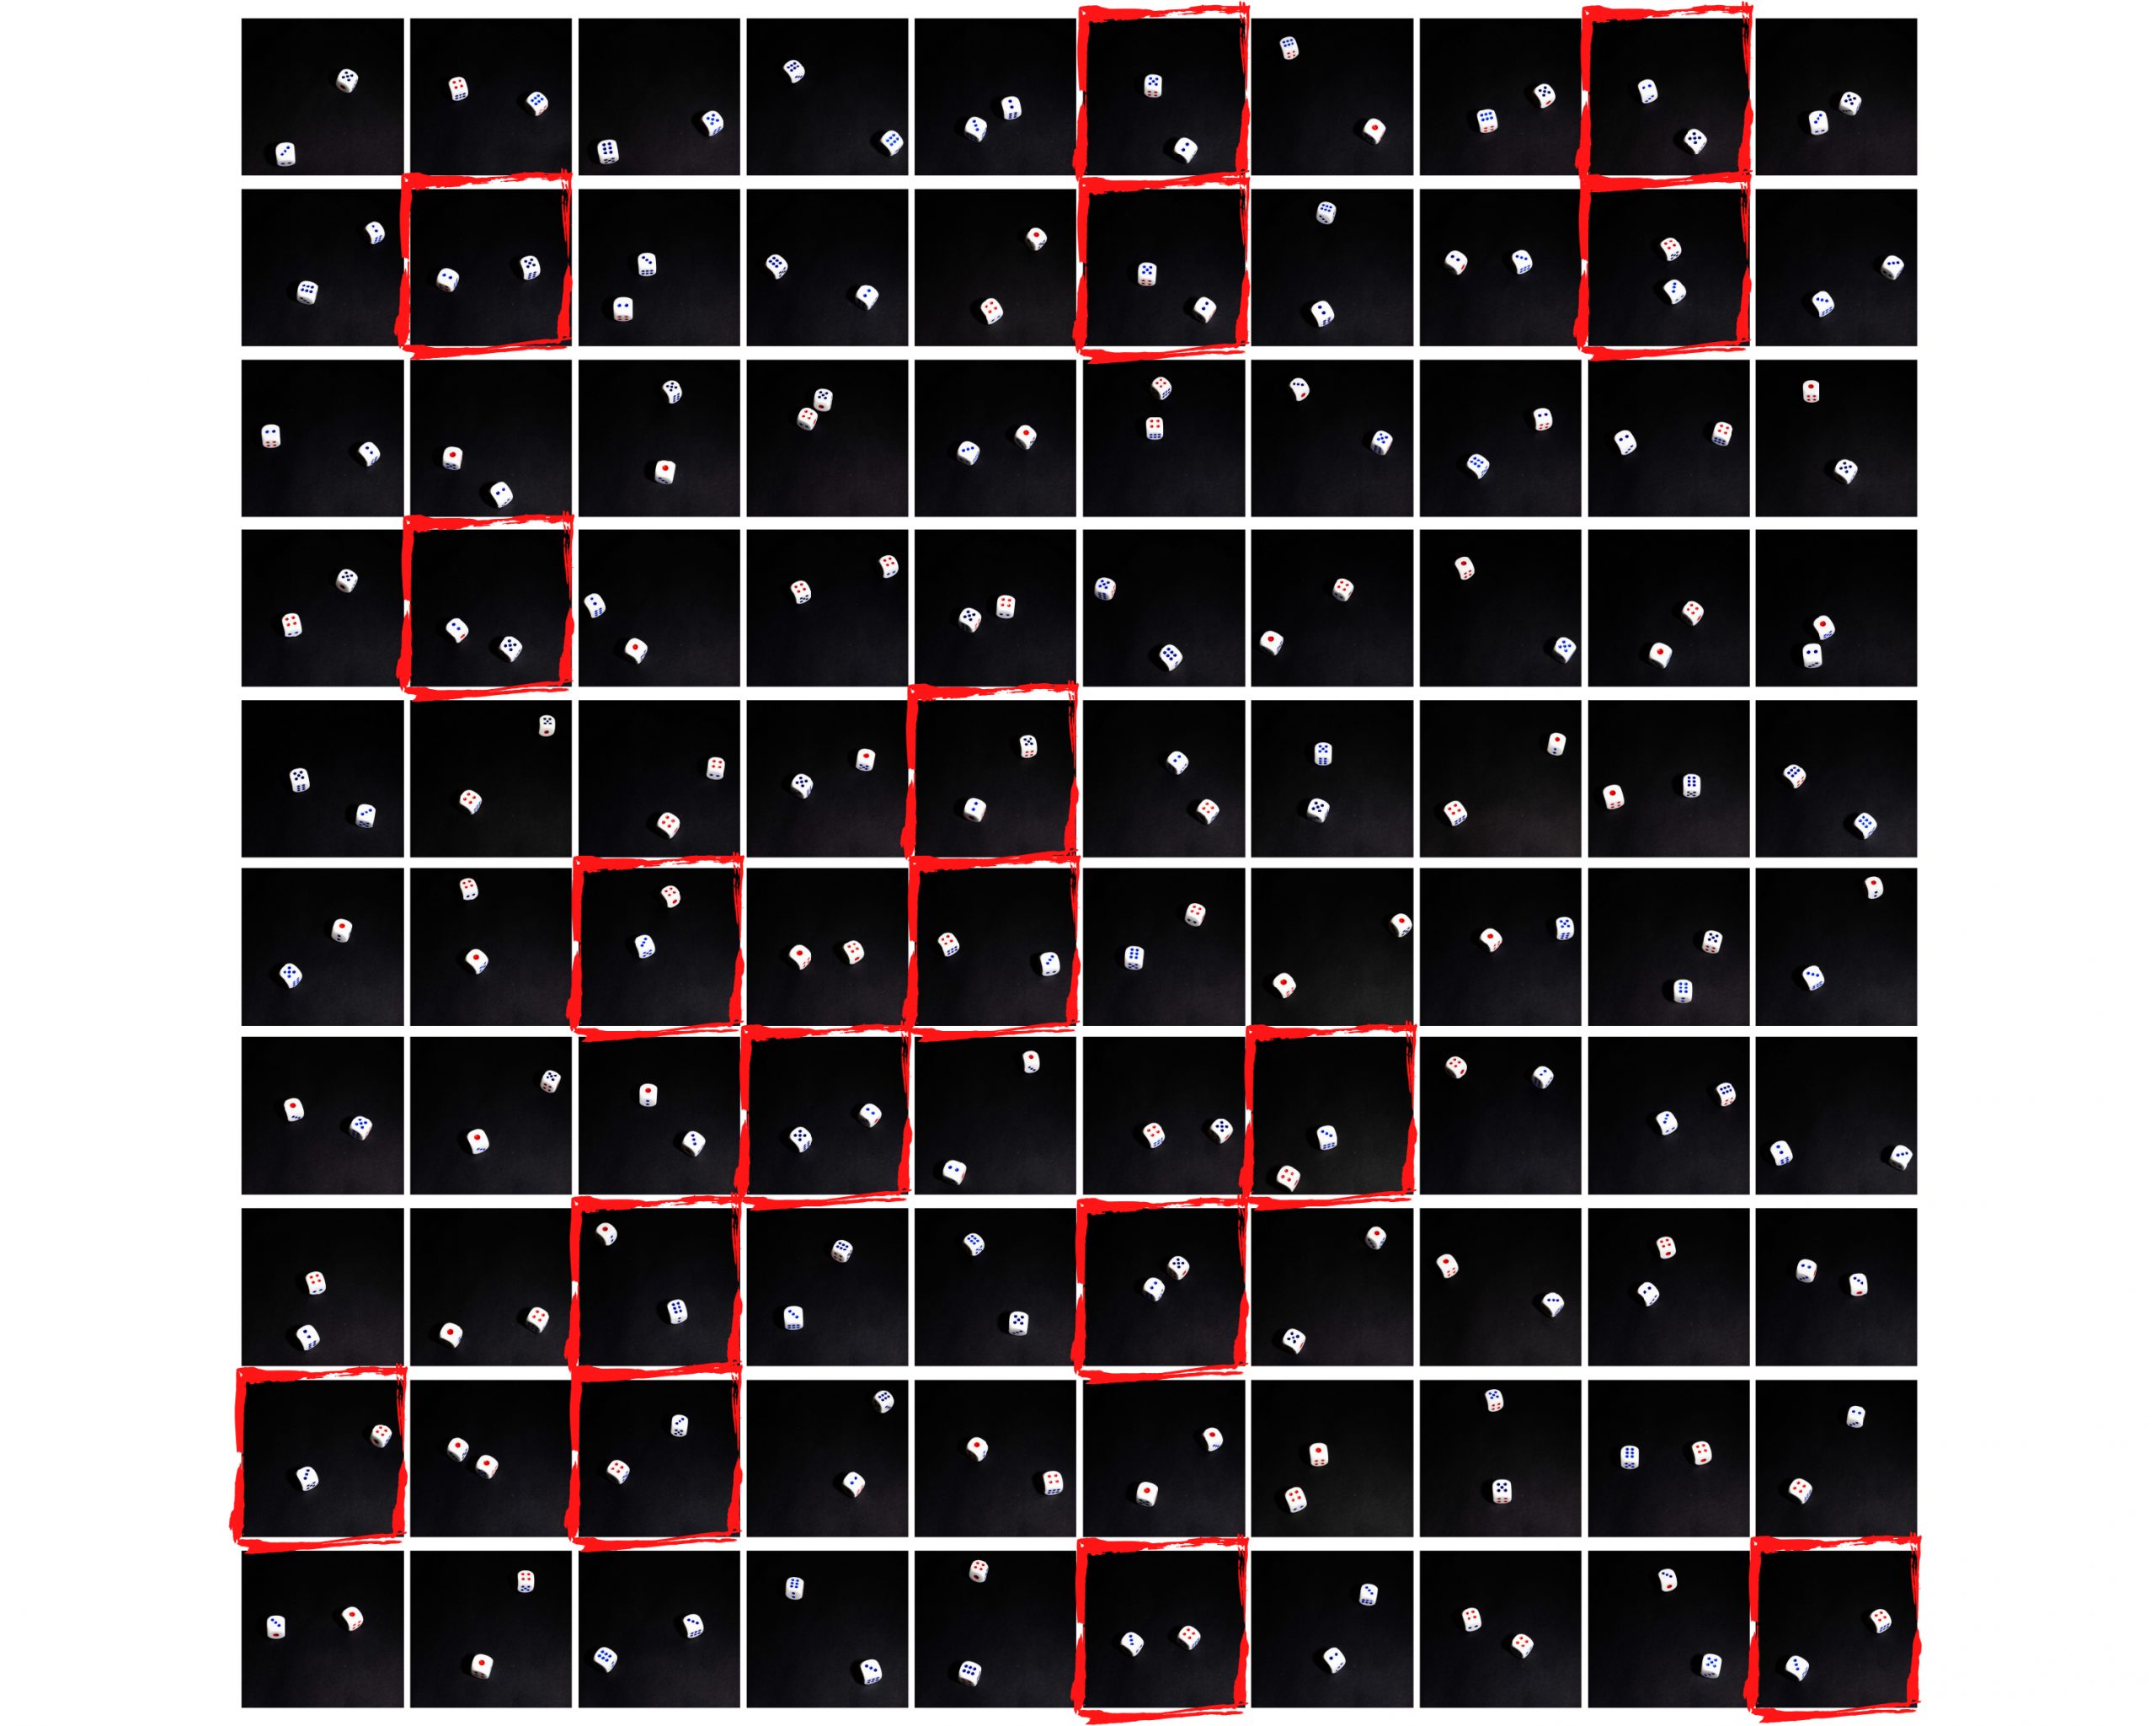
For me, statistics is interesting. It helps me make everyday decisions based on data. Yet the scarce complementary factor is the ability to understand that data and extract value from it. My work might be explaining complicated statistical theories on the caption, but I try to represent them through a collection of simple photographs, e.g. a series of darts throwing pictures to explain data variance or a diptych of garden sample to explain sampling methods.
While working on this project, I was reminded a lot of the illustrations I found in a basic physics book that I read when I was in elementary school. How visualization of theories can help bring joy into some scientific learning. I use the same treatment and start exploring statistics in a very intuitive way and end up seeing it as something fun and not just as a scary subject.


